

How Bad is my Drinking problem? 2020 Analysis
- Josh

- Jan 1, 2021
- 6 min read
Updated: Feb 4, 2021
(This may be TMI, but at its core this blog is about self-improvement, and that’s personal. Writing this down semi-publicly forces me to deal with the issues honestly. I did it for me.)
I drink more than I should. I’m confident about this. But, how do I know? To make the statement precise, I recorded the number of alcoholic beverages I consumed for every day in 2020. Here are the results.
To start, recall a few results from my “lit review” of healthy drinking from late 2019. I will use the Standard Drink Unit (SDU) as my definition of “1 drink”. The recommended maximum drinks/day for men is 2 drinks/day, and the thresholds for “Heavy Drinking” are 4 drinks/day or 14 drinks/week for men, though recently it has been argued that the recommendations for men and women should be the same; for women it’s 3 drinks/day or 7 drinks/week. To make things easy on myself I will use the previous guidelines for men (recommended 2/day, heavy drinking = 4/day or 14/week).
I’m going to be honest here: I’ve spent most of this year misremembering my own recommendations from that post. I thought it was 5/day and 12/week! Therefore my own impression of how well (or badly) I did this year may significantly change as I review the results.
Here goes:
Data: Daily Intake
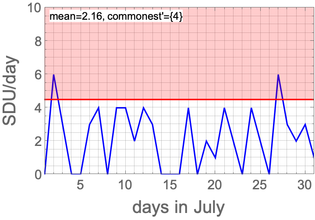
Over the whole year, here are the daily scores:

The red regions correspond to the above cutoffs for heavy drinking, 4 dd being below and 5 dd being above. I joined the data points with a line because I think it looks better than a bunch of individual points. Yes I drank 10 beers one night in January.
In total, I consumed 858 alcoholic beverages in 2020.
For daily intake, the mean number of SDU/day (hereafter, “dd”) was mean=2.34 dd, which is more than the recommended 2 dd. The sample standard deviation (hereafter, “stdev”) was stdev=1.99 dd, but with such a large sample size (N=366) the standard error of the mean (hereafter, “sem”) was very small, sem=stdev/sqrt(N)=0.010 dd. Therefore my mean daily drinking habit was about 3.4 sem units above the acceptable amount.
I investigate the question: Do I drink more than the recommended 2 dd on average? Using a standard t-test, I find a t-score of

This is significant at roughly the 0.002 level, so I can say from this that I drink too much per day with 99.8% confidence.
The data is not consistent with me drinking more than 4 dd on average (“heavy drinking”), though I do this a non-negligible fraction of the time. See below for frequency[dd] = N[dd]/N[all] data.

The modal dd score was 0; if we exclude 0, the mode was 3 dd, which is too much. Roughly, it looks like if I had one drink, I was very likely to have at least one or two more that same day. More generally, 16% of the time I was a heavy drinker (dd≥5); about 30% of the time, I drank too much but not dangerously so (3≤dd≤4); and the other 54% of the time, I drank an acceptable amount (0≤dd≤2).
Let’s break it down month-by-month (apologies in advance, I don’t know why WordPress can’t do a simple square grid without trying to make is fancy fixed it by switching to Wix!):


The highest means came during transition months: January (2.87 dd, I was deciding on postdoc applications), August (3 dd, preparing to leave Israel) and September (3.17 dd, leaving Israel). I do not see a corresponding spike in November for my arrival to Japan. The lowest mean by far was May (1.16 dd), when I made drinking a focus of my New Month Resolution.
The variable commonest’ represents the modal dd excluding 0 dd, which was the actual mode in all months except April, August, September, and October. This isn’t a great variable for characterizing my habits well, since for example, my best month was May but one of May’s commonest’ values is a very unhealthy 7 dd.
Data: Weekly Intake
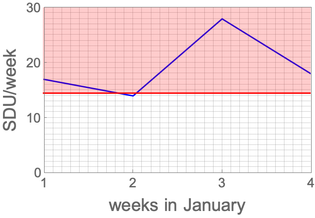
Weekly data may be a better aggregate measure of my habits over time, since there should be fewer large spikes (I tend not to go on multi-day benders). Here’s the raw data:

Red region represents heavy drinking again, 14 dw being below the threshold and 15 dw being above. Note the statistically significant dip around week 18-21, which corresponds to May.
Here the excess is more visually striking. The mean drinks/week (hereafter, “dw”) was mean=16.36 dw, with stdev=4.97 dw and sem=0.69 dw. The mean is about 3.4 sem above the heavy drinking threshold of 14 dw.
So I ask: Am I a heavy drinker, as defined by number of drinks/week? The t-score is

which is significant at the 0.001 level. I’m a heavy drinker, with very high confidence.
Frequency data:

For completeness, here are the weekly breakdowns of individual months. Because 4 weeks = 28 days < length of most months, I’m missing the last few days of every month (from the 29th onward).


Again, the problem seems not to be a few bad weeks, but rather that the typical week is one in which I drink too much.
May was by far the best month on this metric too. In fact, May is statistically-significantly better than the rest. The mean drinks/month (hereafter, “dm”) was 71.5 dm, whereas in May I consumed only 36. The sem for monthly consumption was sem=16.28 dm, so the resulting t-score is

which is significant at roughly 0.05. So my Resolution made a difference at 95% confidence!
Conclusions and Discussion
So the data is in, and I can say with high confidence that I drink far more than is healthy; by reasonable metrics, I am a heavy drinker. I don’t want to be, so how can I learn from what the data is teaching me?
A few takeaways:
When I drink a little, I tend to keep drinking; this is evidenced by the dip in frequency around 1 dd and the peak at 3 dd. It may be preferable to focus on increasing the number of days with 0 dd than to moderate on days that I drink; in 2020 about 1/4 days I was totally sober.
I drink when I’m stressed; this is evidenced by the peaks in January and September, when I was making big life decisions or carrying them out. I should make an effort to reflect on how I’m feeling, and cope in ways that are healthy (more meditation, take walks, talk things out, etc.).
I have power to change my habits when I focus on it; this is evidenced by the good month I had in May. In May my habits were largely healthy, with a mean of close to 1 dd and <10 dw. There were still three days with dd>4, but for the most part it’s a template for a healthier routine.
I should add that, pandemic notwithstanding, I drink a lot less now than I did 3-4 years ago during grad school, though I didn’t have data like this at the time. Given that I’m still a heavy drinker, it’s clear that my habits were extremely unhealthy back then. This is consistent with claims about grad school leading people to alcoholism. If I’m being optimistic, I can use this to say that my trajectory is a good one.
I’m going to use this opportunity to hold myself to some resolutions for next year, which I will assess again with data like above in 2021. The hope is to make every month more like June 2020; although it wasn’t perfect, it was good enough and clearly attainable.
Here are my goals for 2021:
Goal 1: Below the threshold for heavy drinking in every month (c.f. 1/12 in 2020).
Goal 2: At least 50% total days sober (c.f. 28% in 2020).
Goal 3: Fewer than 600 total drinks (c.f. 858 in 2020)
It’s probably correct to say that drinking too much is one of the leading bad habits I have, and it affects many other things I try to do (lose weight, eat healthier, read more, exercise, be punctual, to name a few). Solving this problem in 2021 would represent a major life improvement. I’ve already committed to spending all of January completely sober, which is a good start.
So here we go.


Comments